
What’s your state’s Death Rate? – Above or Below the National Average?


According to provisional data released from the Centers for Disease Control (CDC) in January of this year the overall age-adjusted “Death Rate” in the United States for 2025 was about 722 deaths per 100,000 of population. In the Death Care business we have usually based our historical numbers on a “per 1,000” population number which would make the number 7.22 deaths per 1,000 population.
That number is a decrease from the 2023 number of 7.5 deaths per 1,000 of population. It also brings the death rate down to the lowest level it has been per 1,000 since 2019, or pre-pandemic, when it was at about 7.15 deaths per 1,000 population. Just for comparisons sake, the death rate jumped to a pandemic rate of almost 8.8 age-adjusted deaths per 1,000 population in 2021.
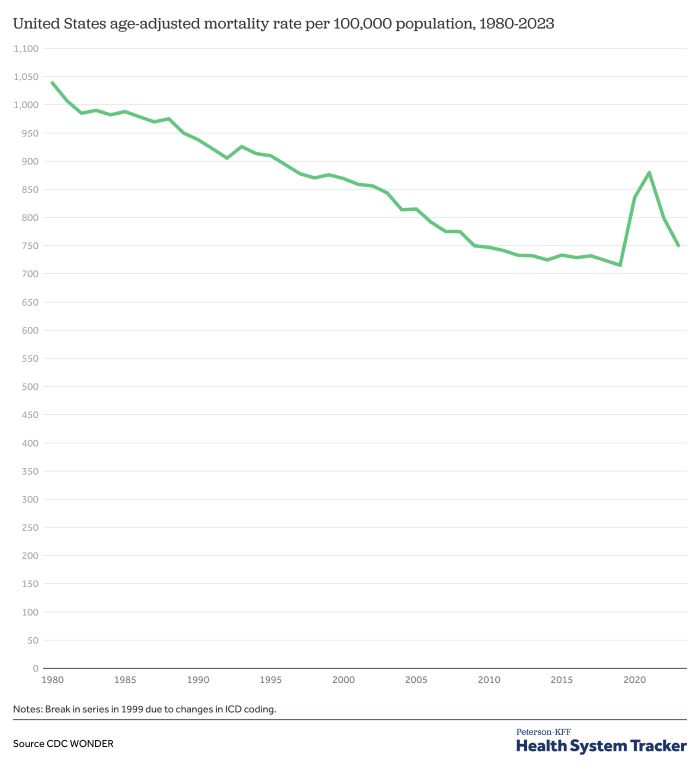
United States “Age-Adjusted” Death Rate 1980 through 2023
I was made aware of this number when I investigated some information on “Population Growth” from 2024 thru 2025. The article that I read and instigated my investigation into death rates was from Minnesota’s Center for the American Experiment and mentioned that migration among states, death rates, and birth rates all play into “Population Growth”.
One of the interesting things I saw in that article, which you can access here, was a listing of states by their estimated death rates for 2024. And, what I found showed a wide discrepancy from the approximate mean of 7.22 deaths per 1,000 population. For instance the highest state death rate was that of West Virginia with a “raw” number almost double that average — at 14.0 deaths per 1,000 population. The lowest death rate found among the states was that of Utah at 6.28 deaths per 1,000 population.
Note- The “Death Rates” from the CDC and those from this Minnesota article should not be “compared” as one is defined as “age adjusted” deaths and the other is simply “raw” deaths. “Age Adjusted” means “statistical calcualtions that remove the effect of different age distributions when comparing mortality across groups”. However, each can be considered in reference as to how they compare with the same numbers (age-adjusted or non-age-adjusted) in their specific comparisons that we are using here.
Here are the “Highest” raw Death Rates by state as listed in the Center for the American Experiment article:
- West Virginia 14.0 / 1,000
- Mississippi 12.1 /1,000
- Maine 11.9 / 1,000
- Arkansas 11.8 / 1,000
- Alabama 11.6 / 1,000
and the states with the “Lowest” raw Death Rates:
- Utah 6.2 / 1,000
- California 7.34 / 1,000
- Texas 7.42 / 1,000
- Colorada 7.48 / 1,000
- Alaska 7.55 / 1,000
The CDC also made this comment about 2024 provisional death rates: “While heart disease and cancer remained top killers, death rates declined across most leading causes, including a significant drop in drug overdose fatalities.” Also, “The top 10 leading causes of death accounted for over 70% of all deaths, with heart disease and cancer remaining the top causes, despite declining rates.”

Tom Anderson
Funeral Director Daily
Funeral Director Daily take: It was very interesting for me to see the linked chart (in the article) which listed provisional 2025 raw Death Rates, Birth Rates, and in/out state migration. One of the things that struck me, is that we look at raw death rates in the United States overall as pretty static between 8-10 deaths/per 1,000 population, the differences in states is somewhat remarkable. . . . . and your local funeral home volume will depend, at least somewhat, on how many deaths are in your market area.
I found it very interesting that in the “raw” data that the highest rate state of West Virginia had more than double the deaths/per 1000 residents than did lowest rate state of Utah. My first assumption, which I still assume, was to guess that Utah is a somewhat younger state per capita than West Virginia. However, when digging into that thought a little more I came across this article from the National Center for Drug Abuse Statistics where I came across this statement, “West Virginia has more drug overdose deaths per capita than any other state, with 80.9 out of every 100,000 residents dying from a drug overdose.”
By the way, South Dakota sees the lowest drug overdose deaths per capita of all the states with a rate of 11.9 out of every 100,000 residents dying from a drug overdose.
So, while this article started as simply an article about the differences in state death rates, it’s also became an article about the sadness of overdose death rates in the United States and a sad statistic about our nation’s care of our young people.
I couldn’t help but notice the following graph. And, when you look at the increase in overdose deaths starting in 2020 you cannot tell if the pandemic or the open border policy contributed to the increase. . . . but, my guess is that both situations did.
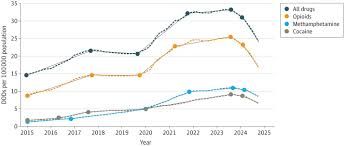
U.S. Drug Overdose Deaths 2015 – 2025
More news from the world of Death Care:
- Some community college bachelor’s programs face pushback from UC, CSA. Daily Bruin (CA)
- Carriage Services announces executive promotions aligned with 2030 Vision and Long-term Strategy Growth. Yahoo Finance
- Lawmakers push for new national cemetery in Hawaii. Video news story and print article. Hawaii News Now (HI)
- Senior Column: What you should know about prepaid funeral plans. Norman Transcript (OK)
Enter your e-mail below to join the 3,201 others who receive Funeral Director Daily articles daily
“A servant’s attitude guided by Christ leads to a significant life”


1 Comment
Leave a Comment


In the words of the great, late Todd VanBeck, “Last time I checked, the death rate was still 100%” 🙂✝️